A 60 SECOND GLANCING EYE ON BUSINESS, MARKETS & ECONOMY

Global Markets


Live World Indices are powered by Investing.com

Monday, 7 March 2016

"Peak Oil Today" - March 7 ,2016

"PEAK OIL TODAY"

The very best weekly analysis and evaluation of the global peak oil situation with additional briefings, charts and videos, added by the curator from accredited professional sources, to enhance the informed investor's knowledge and understanding of its deep complexities and evolving outlooks. 

Everyone should "Bookmark ' this very important weekly post to stay abreast of this most critical aspect of global economics and life on this planet.

Free Logo From Thefreelogomakers.com


Peak Oil Review – 7 March 2016 

By Tom Whipple

Association for the Study of Peak Oil USA


Quote of the Week
 About Latin America: “The 70 percent drop in prices is a major shock. Oil was contributing in some countries from 20 to 50 per cent government revenues and 50 to 96 percent of exports. No wonder we are starting to question the financial viability of some countries and some national oil companies.”

 Luisa Palacios, head of Latin America at Medley Global Advisors, a risk consultancy 


Contents
1.  Oil and the Global Economy
2.  The Middle East & North Africa
3.  China
4.  The Briefs


1.  Oil and the Global Economy


Image result for big banks
Oil prices rose for the third consecutive week with New York futures closing at $35.92 a barrel and London at $38.72. Prices in London are now up 3.9 percent for the year.  Behind the price rise is a continuing drop in the number of drilling rigs operating in the US and the announcement by several major shale oil producers that they plan to suspend new drilling until prices recover. Exactly where profitability is these days is in dispute with some drillers contending they can make money from shale oil if prices rise into the mid- $40s as compared to $60-70 two years ago. Some of these claims are for the benefit of the banks who have become very wary of the oil industry in recent months. The downside, of course, is that if shale oil producers start increasing production if prices get into the mid-$40s, they could easily drive them back down again with unsaleable production. 

   The hype about the “critical mass” of oil producers freezing their production at January levels continues to inspire traders to bid oil prices higher. Most analysts know that included in Moscow’s “critical mass” are only those countries that are already pumping flat out and have little chance of increasing production significantly above January levels. The few countries who can increase production, notably Iran and Iraq, are still doing their best to pump and export more oil. Thus, the hype about a freeze in production is only noise which, of course, helps exporters get more money for their product in a time of overproduction, so they all join into the freeze pact, some with hints that the freeze may someday turn into actual cuts.


Oil’s fundamentals still say that overproduction is alive and well despite small cuts in OPEC and US production in February. The threat of insufficient storage capacity for the excess oil production continues to grow. In the US, the Cushing, Okla. storage facility is now at 90 percent of capacity. In Europe, the large tank farm at Rotterdam has a record number of ships waiting to unload when space for their cargoes becomes available.
The IEA is still saying that supply and demand are unlikely to come back into balance before the end of the year, and even then the world will have 1 billion barrels plus of excess oil in storage that will have to be worked off before significant price increases can occur. Short of export disruptions, most likely to occur somewhere in the Middle East, it may be several years before the markets and the stockpiles come back into balance.  On top of this, we have the uncertainties as to where the Chinese economy is going, as bad economic news from Beijing is frequent these days.
In the meantime, the woes of the global oil and gas industry continue. Some 48 oil and gas producers filed for bankruptcy in North America last year, and more are expected to follow suit in 2016. The newest problem is what happens to the contracts of the “midstream” companies that invested billions in new plants and pipelines to process and deliver crude to refineries. If their oil producers go into bankruptcy, many midstream energy companies will not be far behind as their revenues will dry up. One economist who follows Texas closely notes that the last time oil production was weak there were only about 130,000 people working in the oil industry. This compares to 230,000 workers this January. These numbers imply that we could see another 100,000 Texas oil jobs cut in coming months.
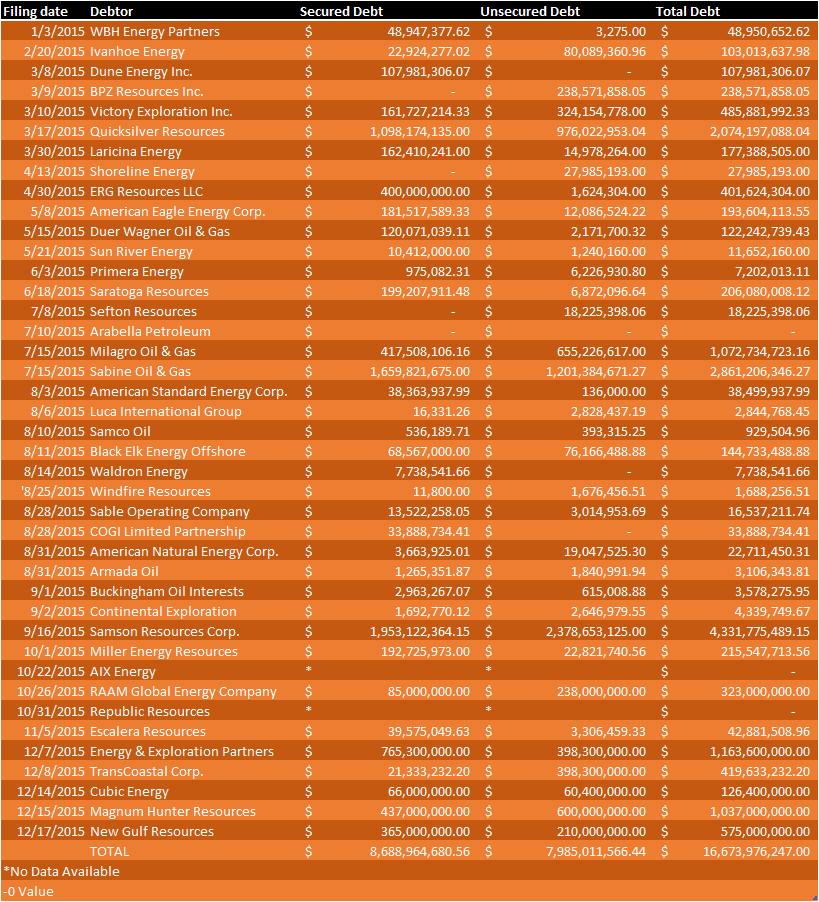
ECI Bankruptcy Table

The Wall Street Journal assures us that while the major banks have advanced billions to companies that have or could go into bankruptcy, there is nothing to worry about as the banks are well diversified with much of their oil lending going to the major integrated producers that are likely to pay back their loans. Even in the banks’ worst case scenario under which oil prices fall to $25 a barrel and stay there for 18 months, the banks say they will be all right.
With natural gas futures now priced around $1.79 per million BTUs, a 17-year low, and cash prices in the Marcellus shale now around $1, many producers are clearly losing a lot of money. There is now a record 2.53 trillion cubic feet of natural gas in storage as the winter gas withdrawal season draws to a close and stocks start rebuilding again. If injections into storage caverns this spring and summer are similar to last year, there may not be enough storage space by September. While export demand is growing, it will be several years before this can have a significant impact on the natural gas glut.  Unless we have an unusually hot summer, it is likely that many producing wells will have to shut-in during the coming year.

 
READ MORE

Sunday, 6 March 2016

Globalization Destroys American Middle Class

Storm the Bastille


In the last analysis, globalization has only benefitted the rich and led to the quiet destruction of society and the middle class. We need to become more self-reliant. more centred in our culture and effect policies that bring middle class jobs back to North American shores.

If we fail and continue on globalization's  clear path to self destruction, then the possibility of a quiet revolution becomes a greater risk t caused by the freshly minted legions of poor middle-class folks. 

History has an odd habit of repeating itself.

"Let them eat cake' 

Free Logo From Thefreelogomakers.com


Why Globalization Reaches Limits

We have been living in a world of rapid globalization, but this is not a condition that we can expect to continue indefinitely.
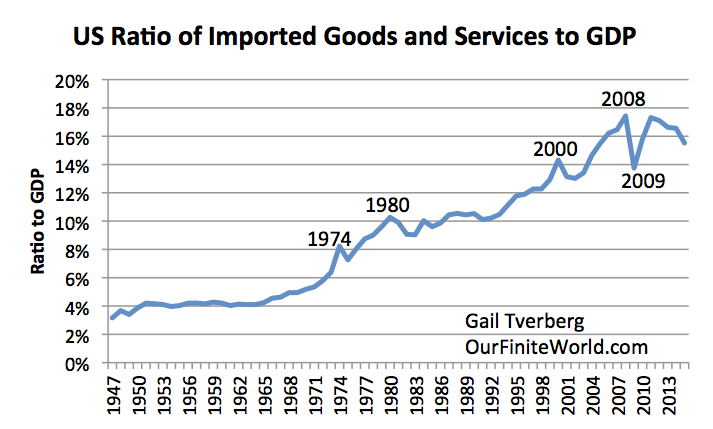
Figure 1. Ratio of Imported Goods and Services to GDP. Based in FRED data for IMPGS.
Each time imported goods and services start to surge as a percentage of GDP, these imports seem to be cut back, generally in a recession. The rising cost of the imports seems to have an adverse impact on the economy. (The imports I am showing are gross imports, rather than imports net of exports. I am using gross imports, because US exports tend to be of a different nature than US imports. US imports include many labor-intensive products, while exports tend to be goods such as agricultural goods and movie films that do not require much US labor.)
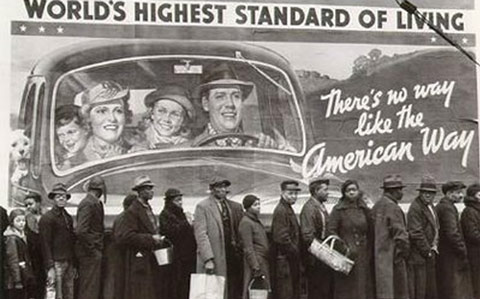
Image result for american in soup lines
 "With the People"   

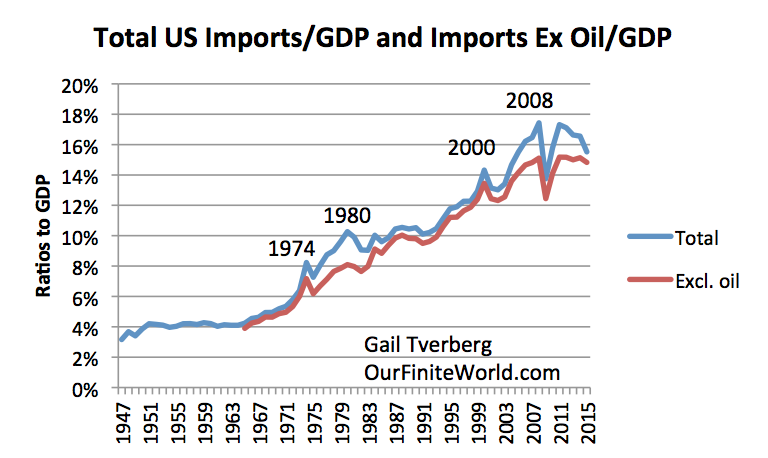
Recently, US imports seem to be down. Part of this reflects the impact of surging US oil production, and because of this, a declining need for oil imports. Figure 2 shows the impact of removing oil imports from the amounts shown on Figure 1.
Figure 2. Total US Imports of Goods and Services, and this total excluding crude oil imports, both as a ratio to GDP. Crude oil imports from https://www.census.gov/foreign-trade/statistics/historical/petr.pdf
Figure 2. Total US Imports of Goods and Services, and this total excluding crude oil imports, both as a ratio to GDP. Crude oil imports from https://www.census.gov/foreign-trade/statistics/historical/petr.pdf
If we look at the years from 2008 to the present, there was clearly a big dip in imports at the time of the Great Recession. Apart from that dip, US imports have barely kept up with GDP growth since 2008.
Let’s think about the situation from the point of view of developing nations, wanting to increase the amount of goods they sell to the US. As long as US imports were growing rapidly, then the demand for the goods and services these developing nations were trying to sell would be growing rapidly. But once US imports flattened out as a percentage of GDP, then it became much harder for developing nations to “grow” their exports to the US.
I have not done an extensive analysis outside the US, but based on the recent slow economic growth patterns for Japan and Europe, I would expect that import growth for these areas to be slowing as well. In fact, data from the World Trade Organization for Japan, France, Italy, Sweden, Spain, and the United Kingdom seem to show a recent slowdown in imported goods for these countries as well.
If this lack of demand growth by a number of industrialized countries continues, it will tend to seriously slow export growth for developing countries.
Where Does Demand for Imports Come From?
Many of the goods and services we import have an adverse impact on US wages. For example, if we import clothing, toys, and furniture, these imports directly remove US jobs making similar goods here. Similarly, programming jobs and call center jobs outsourced to lower cost nations reduce the number of jobs available in the US. When US oil prices rose in the 1970s, we started importing compact cars from Japan. Substituting Japanese-made cars for American-made cars also led to a loss of US jobs.

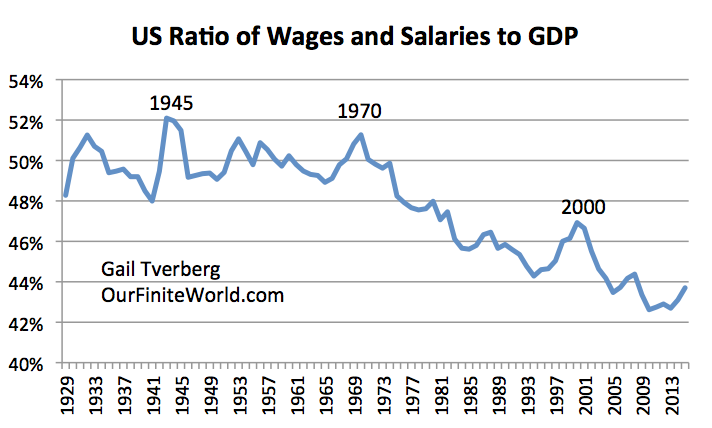
Even if a job isn’t directly lost, the competition with low wage nations tends to hold down wages. Over time, US wages have tended to fall as a percentage of GDP.
Figure 3. Ratio of US Wages and Salaries to GDP, based on information of the US Bureau of Economic Analysis.
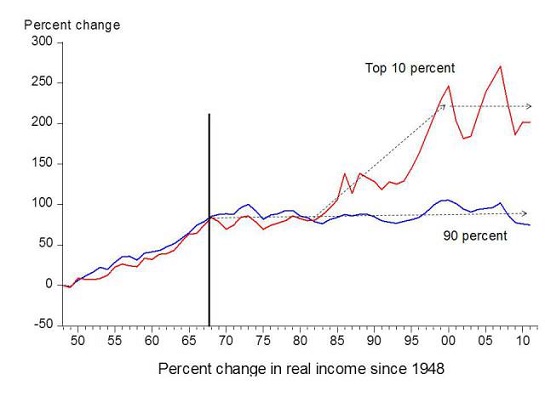
Image result for american in soup linesAnother phenomenon that has tended to occur is greater disparity of wages. Partly this disparity represents wage pressure on individuals doing jobs that could easily be outsourced to a lower-wage country. Also, executive salaries tend to rise, as companies become more international in scope. As a result, earnings for the top 10% have tended to increase since 1981, while wages for the bottom 90% have stagnated.
Figure 4. Chart by economist Emmanuel Saez based on an analysis IRS data, published in Forbes.

READ MORE

Free Logo From Thefreelogomakers.com

Blog Archive

Earth In Trouble